
🎓
TIER 1
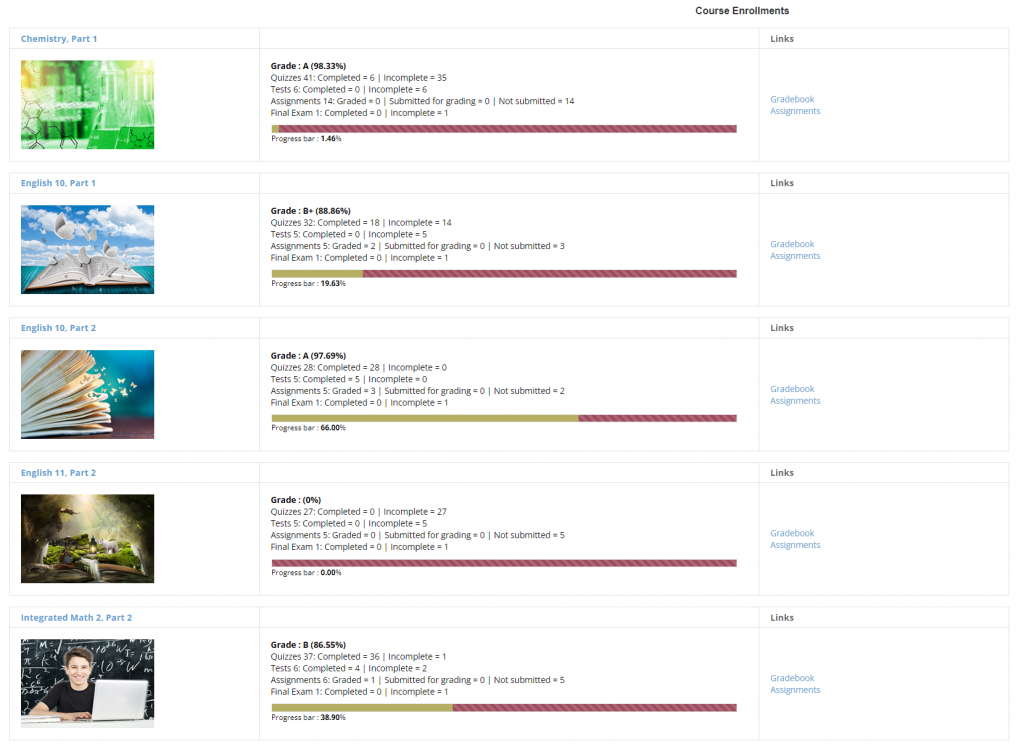
Student Dashboard
Students track their own progress through a personal dashboard with built-in pacing guides. Self-paced doesn't mean self-guessing — students always know exactly where they stand and where they need to be.

Personalized Pacing Guide — Powered by Zip
Zip, our AI pacing coach, works with each student to set a target completion date and builds a personalized day-by-day schedule to get there. If a student falls behind, Zip sends a nudge and adjusts the plan — so small slip-ups never become big problems.
✓
Assignment Tracking
Clear view of completed, pending, and upcoming assignments with due dates
✓
Grade Summary
Running grade calculations with performance trends across each course
✓
AI Tutor Access
One-click access to Sage AI Tutor for 24/7 personalized learning support
👩🏫
TIER 2
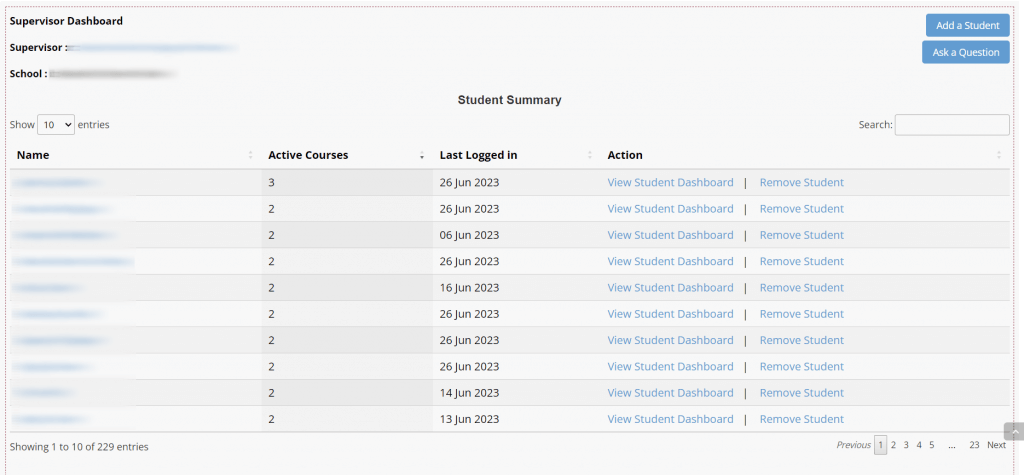
Teacher Dashboard
Teachers get a clear, at-a-glance summary of their entire class — then can drill down into any individual student's dashboard for a deeper look at progress, activity, and performance.
✓
Class-Wide Summary View
See a high-level snapshot of all students in one place — who's active, where they are in the course, and how they're doing overall
✓
Per-Student Drill-Down
Click any student to open their individual dashboard and review their activity, progress, and grades in detail
✓
Designed for Teacher Workflow
The dashboard is built around how teachers actually work — quick overview first, detail on demand
"Data doesn't replace teacher judgment — it informs it. Teachers still decide how to help; the dashboard shows them where to look."
EXPLORE THE PLATFORM
See What Powers the Dashboard Ecosystem
📊
QuickSight Q Analytics
Deep dive into how natural language querying transforms educational decision-making.
Learn more →

AI Assistants & Sage Tutor
Seven AI assistants providing 24/7 personalized student support across every course.
Learn more →
☁️
AWS Enterprise Infrastructure
Near 100% uptime, automatic disaster recovery, and zero IT burden for your school.
Learn more →